Evaluate your investment returns with the performance report
One of Sharesight’s most popular reports, the performance report gives you the full picture of your portfolio’s returns over any chosen period. Unlike most brokers, Sharesight shows you a true picture of your performance by calculating returns on a money-weighted basis, while taking into account key factors such as the impact of capital gains, dividends, foreign currency and brokerage fees — providing the insights you need to make educated investment decisions. To learn more about how to make the most out of the performance report, keep reading.
What is the performance report?
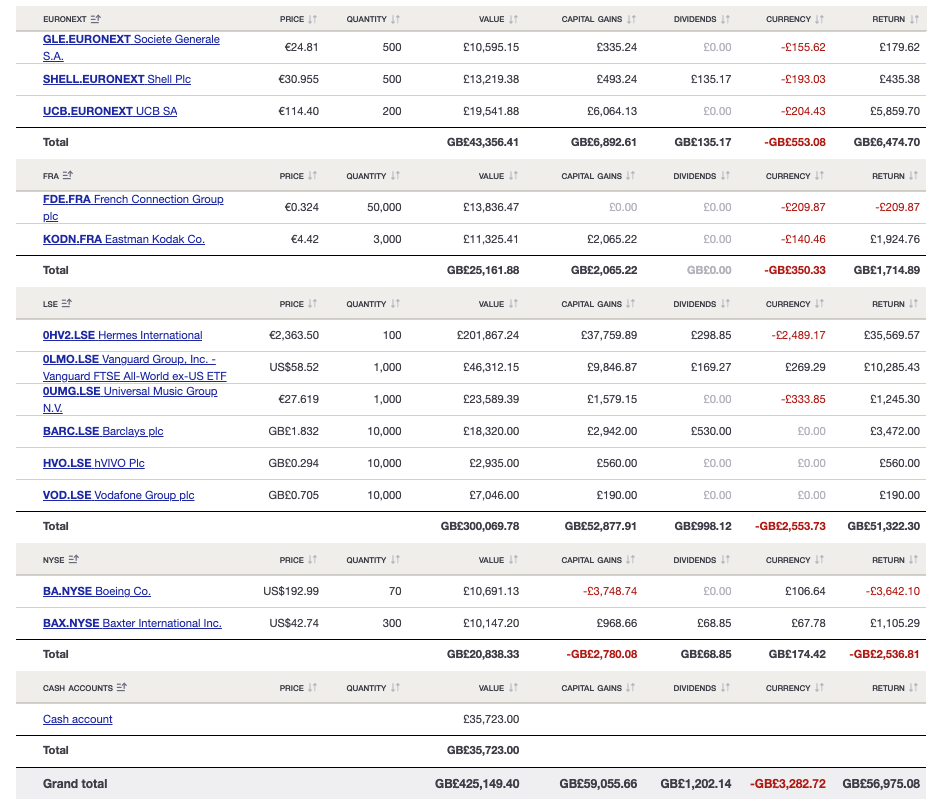
Sharesight’s performance report allows you to clearly compare the performance of different assets in your portfolio over the time period of your choice. This is particularly useful if you have mixed-asset portfolios and global investments, as it allows you to clearly see the cumulative impact of capital gains, dividends, foreign currency and brokerage fees on your returns.
While most brokers simply show you the difference between the buy and sell (or current) price of your investments, Sharesight considers the factors listed above to calculate returns on an annualised and money-weighted basis. This is done so you can get a comprehensive view of your investment performance and understand how an allocation of capital has performed over the time it has been invested.
 The performance report is ideal for investors with mixed-asset portfolios and global investments.
How the report helps you evaluate your returns
Highly customisable, the performance report has a number of features that help you evaluate your portfolio’s returns. Some of the key benefits include:
See a visual map of your performance
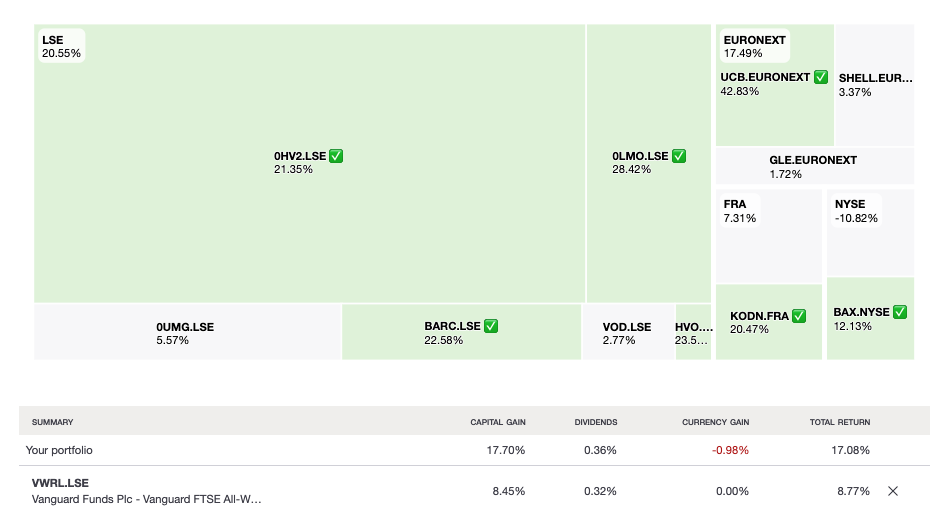
The performance report uses a treemap visualisation to make it easy to see how assets in your portfolio have performed over your selected time period. The screenshot below, for example, shows the performance treemap of a portfolio with various European and US investments. In this example, the report has been grouped by market, however you also have the option to group the report by currency, sector classification, industry classification, investment type, country, no grouping or a custom grouping of your choice.
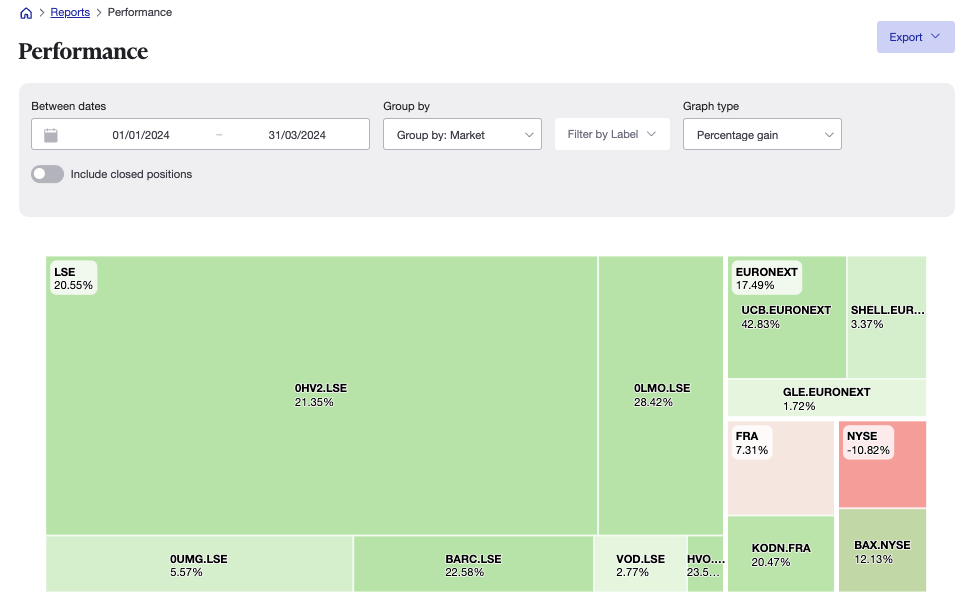
The performance treemap of a global investment portfolio, sorted by market. Note: You can hover over each asset for more detailed information.
Assets are listed in descending order, with the size of each rectangle representing the monetary value of the asset relative to the size of the portfolio. In the example above for instance, 0HV2.LSE has the largest rectangle because it represents a value of £201,867.24, which is by far the highest value in the overall portfolio. By comparison, 0LMO.LSE only represents £46,312.15, which is why the rectangle is significantly smaller.
In terms of percentage values, the white rectangles at the top left of each group represent the group’s contribution to the overall portfolio value. The percentages under each asset’s name represent its returns over the reporting period. For example, in the screenshot above, you can see that the LSE has the highest contribution to the portfolio’s overall value at 20.55%, followed by the EURONEXT at 17.49%. And while UCB.EURONEXT has the highest returns at 42.83%, 0HV2.LSE (which has a 21.35% return) takes up far more space in the treemap because it represents a significantly higher monetary value than UCB.EURONEXT.
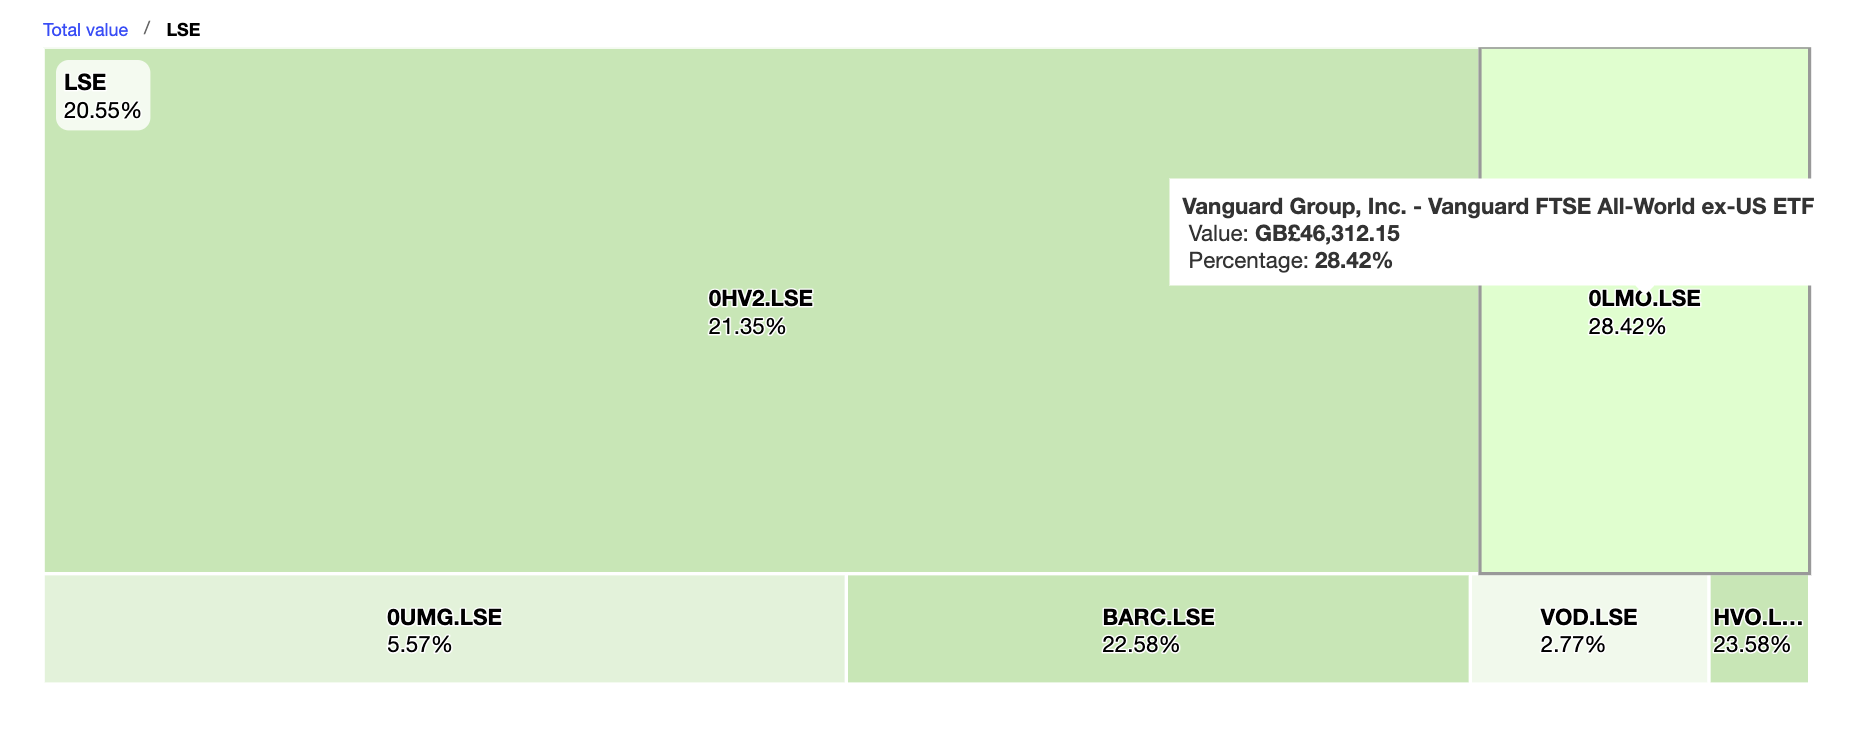
Note: If you click on an asset in the treemap, you can zoom into its grouping for a closer look.
Compare your performance against a benchmark
Along with the ability to compare the performance of your assets with each other, the performance report also gives you the option to benchmark your performance against any one of the 500,000+ global stocks, ETFs and funds that Sharesight supports. By comparing your performance to a particular market or stock index, for example, you can put your portfolio’s performance into context and better evaluate your investing strategy.
The performance report gives you the option to benchmark your performance against the stock, ETF or fund of your choice.
In the example above, there are several assets represented by green rectangles, with green tick icons. This indicates that they are beating the benchmark. Assets denoted by a grey rectangle are those that are not beating the benchmark. Below the treemap you can also see your portfolio’s returns compared to the benchmark, broken down by capital gains, dividends and currency gain — giving you deeper insight into exactly where your portfolio matches or diverges from its benchmark.
Other key features
- Custom date ranges: Choose from a range of pre-defined reporting periods or select your own custom date range
- Toggle options: You have the option to toggle between showing open and closed positions (current and sold assets), or restricting the report to show open positions only
- Groups: As mentioned above, you have the option to group the assets in your report by market, currency, sector classification, industry classification, investment type, country or a custom group. You can also opt to leave your assets ungrouped
- Labels: You can filter your results by creating custom labels to break down the results of the report by your own custom dimensions in combination with or separate from your own custom groups
- File exporting: The report can be exported into a number of different file formats, including PDF, Excel spreadsheet or Google Sheet.
Get deeper performance insights with Sharesight
If you’re not already using Sharesight, what are you waiting for? Join hundreds of thousands of investors using Sharesight to track their performance and get the insights they need to make better decisions. Sign up today so you can:
- Track all your investments in one place, including stocks in over 60 major global markets, mutual/managed funds, property and even cryptocurrency
- Automatically track your dividend and distribution income from stocks, ETFs and mutual/managed funds
- Run powerful reports built for investors, including performance, portfolio diversity, contribution analysis, multi-period, multi-currency valuation, exposure and future income (upcoming dividends)
- Easily share access to your portfolio with family members, your accountant or other financial professionals so they can see the same picture of your investments as you do.
Sign up for a FREE Sharesight account and get started tracking your investment performance (and tax) today.
FURTHER READING


Sharesight product updates – May 2024
This month's focus was on expanding our broker support and streamlining the customer onboarding journey, as well as additional reporting and holding functions.


Top 20 NZX trades by Sharesight users – April 2024
Welcome to the April 2024 edition of Sharesight’s monthly NZX trading snapshot, where we look at the top 20 trades Sharesight users made on the NZX.


Top 20 trades in US stocks by Sharesight users – April 2024
Welcome to the April 2024 edition of Sharesight’s monthly USA trading snapshot, where we look at Sharesight users’ top 20 trades in US stocks.